 |
| Photo by Lucas Benjamin on Unsplash |
Data is a collection of facts and figures, observations, or descriptions of things in an unorganized or organized form. Data can exist as images, words, numbers, characters, videos, audios, and etcetera.
What is data preprocessing
To analyze our data and extract the insights out of it, it is necessary to process the data before we start building up our machine learning model i.e. we need to convert our data in the form which our model can understand. Since the machines cannot understand data in the form of images, audios, etc.
Data is processed in the form (an efficient format) that it can be easily interpreted by the algorithm and produce the required output accurately.
The data we use in the real world is not perfect and it is incomplete, inconsistent (with outliers and noisy values), and in an unstructured form. Preprocessing the raw data helps to organize, scaling, clean (remove outliers), standardize i.e. simplifying it to feed the data to the machine learning algorithm.
The process of data preprocessing involves a few steps:
- Data cleaning: the data we use may have some missing points (like rows or columns which does not contain any values) or have noisy data (irrelevant data that is difficult to interpret by the machine). To solve the above problems we can delete the empty rows and columns or fill them with some other values and we can use methods like regression and clustering for noisy data.
- Data transformation: this the process of transforming the raw data into the format that is ready to suitable for the model. It may include steps like- categorical encoding, scaling, normalization, standardization, etc.
- Data reduction: this helps to reduce the size of the data we are working on (for easy analysis) while maintaining the integrity of the original data.
Scikit-learn library for data preprocessing
Scikit-learn is a popular machine learning library available as an open-source. This library provides us various essential tools including algorithms for random forests, classification, regression, and of course for data preprocessing as well. This library is built on the top of NumPy and SciPy and it is easy to learn and understand.
We can use the following code to import the library in the workspace:
import sklearnfrom sklearn import preprocessingStandardization
Standardization is a technique used to scale the data such that the mean of the data becomes zero and the standard deviation becomes one. Here the values are not restricted to a particular range. We can use standardization when features of input data set have large differences between their ranges.
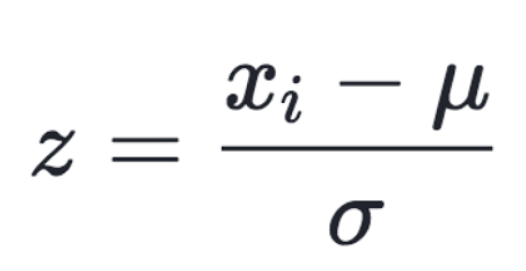 |
| The formula for standardization of data |
Let us consider the following example:
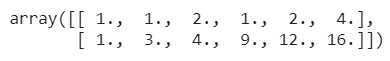
from sklearn import preprocessingimport numpy as npx = np.array([[1, 2, 3],[ 4, 5, 6],[ 7, 8, 9]])y_scaled = preprocessing.scale(X_train)print(y_scaled)
Here we have an input array of dimension 3x3 with its values ranging from one to nine. Using the scalefunction available in the preprocessing we can quickly scale our data.
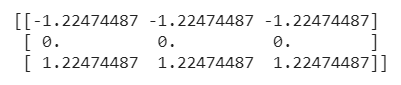 |
| Scaled data |
There is another function available in this library StandardScaler, this helps us to compute mean and standard deviation to the training set of data and reapplying the same transformation to the training dataset by implementing the Transformer API .
If we want to scale our features in a given range we can use the MinMaxScaler(using parameter feature_range=(min,max)) or MinAbsScaler (the difference is that the maximum absolute value of each feature is scaled to unit size in MinAbsScaler)
from sklearn.preprocessing import MinMaxScalerimport numpy as npx = MinMaxScaler(feature_range=(0,8))y = np.array([[1, 2, 3],[ 4, -5, -6],[ 7, 8, 9]])scale = x.fit_transform(y)scale
Here the values of an array of dimension 3x3 are scaled in a given range of (0,8)and we have used the .fit_transform() function which will help us to apply the same transformation to another dataset later.
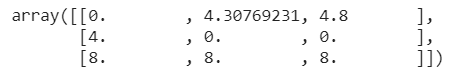 |
| Scaled data in a specified range |
Normalization
from sklearn import preprocessingimport numpy as npX = [[1,2,3],[4,-5,-6],[7,8,9]]y = preprocessing.normalize(X)y
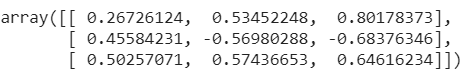 |
| Normalized data |
Transformer API, by using the Normalizer function which implements the same operation.Encoding categorical features
Many times the data we use may not have the features values in a continuous form, but instead the forms of categories with text labels. To get this data processed by the machine learning model, it is necessary for converting these categorical features into a machine-understandable form.
There are two functions available in this module through which we can encode our categorical features:
- OrdinalEncoder: this is to convert categorical features to integer values such that the function converts each categorical feature to one new feature of integers (0 to n_categories — 1).
import sklearn.preprocessingimport numpy as npenc = preprocessing.OrdinalEncoder()X = [['a','b','c','d'], ['e', 'f', 'g', 'h'],['i','j','k','l']]enc.fit(X)enc.transform([['a', 'f', 'g','l']])
0,1,2 and the output result for the above input is: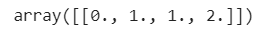 |
| Encoded data |
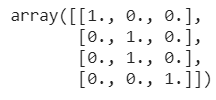
- OneHotEncode: this encoder function transforms each categorical feature with
n_categoriespossible values inton_categoriesbinary features, with one of them 1, and all others 0. Check the following example for a better understanding.
import sklearn.preprocessingimport numpy as npenc = preprocessing.OneHotEncoder()X = [['a','b','c','d'], ['e', 'f', 'g', 'h'],['i','j','k','l']]enc.fit(X)enc.transform([['a', 'f', 'g','l']]).toarray().reshape(4,3)
 |
Discretization
The process of discretization helps us to separate the continuous features of data into discrete values (also known as binning or quantization). This is similar to creating a histogram using continuous data (where discretization focuses on assigning feature values to these bins). Discretization can help us introduce non-linearity in linear models in some cases.
import sklearn.preprocessingimport numpy as npX = np.array([[ 1,2,3],[-4,-5,6],[7,8,9]])dis = preprocessing.KBinsDiscretizer(n_bins=[3, 2, 2], encode='ordinal')dis.fit_transform(X)
Using the KBinsDiscretizer(), the function discretizes the features into k bins. By default, the output is one-hot encoded, which we can change with the encode parameter.
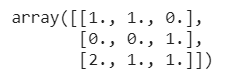 |
| Data discretization |
Imputation of missing values
from sklearn.impute import SimpleImputerimport numpy as npimpute = SimpleImputer(missing_values=np.nan, strategy='mean')X = [[np.nan, 1,2], [3,4, np.nan], [5, np.nan, 6]]impute.fit_transform(X)
SimpleImputer() function for imputing the missing values. The parameters used in this function are missing_values to specify the missing values to be imputed, strategy to specify how we want to impute the value, like in the above example we have used mean, this means that the missing values will be replaced by the mean of column values. We can use other parameters for strategy, like median, mode, most_frequent (based on the frequency of occurrence of particular value in a column), or constant (a constant value).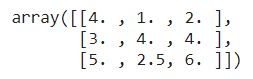 |
| Imputing missing values |
Generating polynomial features
PolynomialFeatures().import numpy as npfrom sklearn.preprocessing import PolynomialFeaturesx = np.array([[1,2],[3,4]])nonl = PolynomialFeatures(2)nonl.fit_transform(x)
 |
| Generating polynomial features |
2 in the PolynomialFeatures() function. The feature values of the input array are transformed from (X1, X2) to (1, X1, X2, X1², X1*X2, X2²).Custom transformers
FunctionTransformer() and passing the required function through it.import sklearn.preprocessingimport numpy as nptransformer = preprocessing.FunctionTransformer(np.log1p, validate=True)X = np.array([[1,2,3],[4,5,6],[7,8,9]])transformer.transform(X)
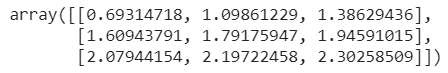 |
| Implementing custom transformers |
Conclusion
For a better understanding of these concepts, I will recommend you try implementing these concepts on your once. Keep exploring, and I am sure you will discover new features along the way.
If you have any questions or comments, please post them in the comment section.

Wow, cool post. I’d like to like this too – taking time and real hard work to make a great article… but I put things off too much and never seem to get started. Thanks though.
ReplyDeletemulti-touch attribution
Excellent Blog! I would Thanks for sharing this wonderful content. Its very useful to us.I gained many unknown information, the way you have clearly explained is really fantastic.keep posting such useful information.
ReplyDeleteData science is a quickly developing field. So, to get your data science certifications in R, Python, and SQL or learn Hadoop or Apache Spark, practice everything learn, every day.
Why Get Certified as a Data Scientist?
Thanks for sharing this article here about the pragramming learning platform. Your article is very informative and I will share it with my other friends as the information is really very useful. Keep sharing your excellent work.pragramming learning platform
ReplyDeleteThis post is incredibly simple to examine and recognize without disregarding any nuances. Inconceivable work!
ReplyDeletedata scientist online course
Innomatics Research Labs is collaborated with JAIN (Deemed-to-be University) and offering the Online MBA in Artificial intelligence from Jain University. This course helps in analyzing data, making predictions and decisions for a better understanding of market trends, creating disruptive business models for the topmost industries.
ReplyDeleteOnline MBA in Artificial intelligence from Jain University
I read that Post and got it fine and informative. Please share more like that... Great Article is really informative . Its was really valuable. Thanks a lot. Artificial Intelligence Course in Muscat | Robotic And Coding For Kids in Muscat | Digital Marketing Training in Muscat | SEO Services in Muscat
ReplyDeleteThis is my first time visit here. From the tons of comments on your articles. I guess I am not only one having all the enjoyment right here.
ReplyDeleteComplete Python Programming Training Course in Delhi, India
Python training institute in delhi
Python training Course in delhi
Today a wide variety of technologies are used in order to create artificial intelligence programs which are capable of running artificial intelligence software apps
ReplyDeleteartificial intelligence development company
Thanks for sharing this blog with us. Keep sharing more.
ReplyDeleteAI Course in Hyderabad
Machine Learning in Hyderabad
Wow it is really wonderful and awesome thus it is very much useful for me to understand many concepts and helped me a lot.
ReplyDeletePython Training Institute in Delhi- Education Have another Serving
Solidworks training in Delhi- Education the River Of Life
Great and knowledgeable article, I'm really impressed and thanks for sharing your knowledge with us.
ReplyDeleteCertified AutoCAD Training Institute in Delhi, India
Authorized 3D Max training Institute in Delhi, NCR
I really enjoy the article.Thanks Again. Fantastic.
ReplyDeletedata science training india
data science course hyderabad online
Very Nice, Thanks for sharing such an informative Article. I really Enjoyed. It was great reading this article. I would like to know more about Big Data Engineering Services.
ReplyDeleteData Analytics Solutions
Hi, Thanks for sharing very useful content...
ReplyDeleteImage Data Entry
Its an really amazing blog post that made me learn about digital marketing from beginning level and also found the professional Social media marketing Dubai, thanks for sharing the blog with us.
ReplyDeleteHi, Thanks for sharing nice articles...
ReplyDeleteBest CA Company in india
This is really very nice post you shared, i like the post, thanks for sharing..
ReplyDeletefull stack developer course with placement
Do you need the best aged web leads for small business in NY, CA & FL? We generate high converting aged MCA leads using direct email marketing, Google & Facebook Ads.
ReplyDeleteTargeted B2B Sales Lead TX
Data Cleansing Company NY
Thanks for sharing this blog with us. Keep sharing more. Check out the Leadership Coaching Services by Coach Dr. Paras, a well-known leadership coach all over the world.
ReplyDeleteThanks for sharing this blog with us. Keep sharing more. Check out the leadership coaching services by Certified Leadership Coach Dr. Paras, a well-known leadership coach all over the world.
ReplyDeleteIts was amazing to read this article. A proper knowledge for master data engineering. Thank you for sharing such an amazing post.
ReplyDeleteGreat information, thank you for sharing this content.
ReplyDeleteData Engineering Training
Thanks for the great article.
ReplyDeletehttp://informaticsprofessor.blogspot.com/2015/07/what-is-difference-if-any-between.html
What a fabulous job you did here for your numerous readers, fans and followers. In the modern techno trendy world the term data processing, data science is very important and considerable to all technology lovers and learners. I was impressed to see how well you explained about what is data processing, steps for data processing and a meaningful conclusion. That's really amazing. Thanks for sharing such a quality piece of work. Also for the readers from India especially Nagpur, I would like to recommend to participate in data science course in nagpur. This can really be an effecting achievement,
ReplyDeleteI am so grateful for your blog.Really thank you!
ReplyDeletedata cleansing algorithms