 |
| (Photo by Chris Liverani on Unsplash) |
Numpy (stands for — Numerical Python) is a library available in Python programming language, supporting matrix data structures and multidimensional array objects. This the most basic scientific computing library that we need to learn, to begin our journey in the field of data science.
Numpy can compute basic mathematical calculations to make the process of creating advanced machine learning and artificial intelligence applications easier (by using comprehensive mathematical functions available within the library). Numpy allows us to carry out various complex mathematical calculations effortlessly along with several top-up libraries (like matplotlib, pandas, scikit-learn, etc.) built over it.
This library is a great tool for every data science professional to handle and analyze the data efficiently. Moreover, it is much easier to perform mathematical operations with numpy arrays in comparison to python’s list.
Numpy library has various functions available in it. In this article, we will learn some essential and lesser-known functions of this library and how to implement them efficiently.
Note: In this article, we will be using Google Colaboratory to execute our codes.
Importing numpy
Numpy can be simply imported in the notebook by using the following code:
import numpy as npHere, numpy is written as np to save time while coding, and also it is a de facto in the data science community.
Now, let’s get started with numpy functions!
Creation of n-dimensional array using numpy
An array is a data structure in the numpy library, which is just like a list which can store values, but the differences are that we can specify the data type of elements of an array ( dtype function) and arrays are faster and take less memory to store data, allowing the code to be optimized even further.
To create a single-dimensional array we can use the following code:
import numpy as nparray = np.array([1,2,3,4,5])
The process for creating a multi-dimensional array is similar, we just have to add more values in []brackets:
array = np.array([[1.1,2.2,3.0,4.6,5.0],[6.4,7.3,8.5,9.1,10.2])numpy.linsapce() function
This numpy.linspace() function is used to create an array of evenly spaced numbers in a given interval. We can also determine the number of samples we want to generate (however, it is an optional parameter default value is set to fifty samples). Another optional parameter we can add to this function is restep which if True will return the space i.e. spacing between the samples along with the list. The function is: numpy.linspace(start, stop) . Let’s apply this function in an example:
import numpy as npimport matplotlib.pyplot as pltx = np.linspace(0,10,10,dtype = int, retstep=True)print(x)x = np.linspace(0,10,100)y = np.sin(x)plt.plot(x,y,color = 'orange')plt.show()
As we can see here, even to calculate mathematical functions we are using numpy library. We used the linspace() function to generate equally spaced values and used that array to plot sine function plot.
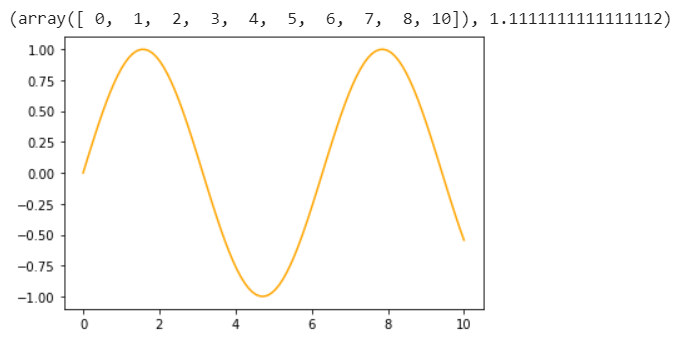 |
| (Image by Author) sine function graph using linspace() function to generate values |
Function for random sampling
Here, the numpy.random function helps us calculate random values in various ways like generating random values in a given shape, generating an array by randomly selecting values from a given 1D array, or randomly permute a sequence of a given array or a range.
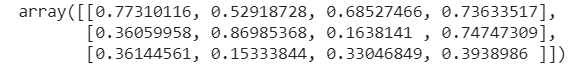
- numpy.random.rand(): With this function, we can create an array of uniformly distributed values over given input shape in a range [0,1) (i.e. ‘1’ is excluded). For example:
np.random.rand(3,4)As we can see in this example, an array of shape (3,4) is generated with all values lying in a range of [0,1).
- numpy.random.choice(): This random function returns an array of random samples from a given input array. Other optional parameters that we can define are-
sizei.e. the output shape of the array,replacei.e. whether we want repeated values in our output array andpi.e. probability for each given sample of the input array. Check out the following example:
np.random.choice([1,2,3,4],(1,2,3),replace=True,p=[0.2,0.1,0.4,0.3])Here, we have given the following input parameters to the functions- an input array with four elements, shape of output array ( 1 in the above code is the numbers of the arrays we want as output and 2,3 is output shape), repetition of values is True and probability for each sample (where the sum of values should be equal to one).

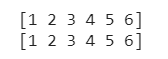
- np.random.permutation(): This function returns an array with a randomly permutated sequence (in case of input array) or a permuted range (in case of single-input).
arr = np.random.permutation(5) print('Permutation of a range: ' + str(arr)) arr_ = np.random.permutation([1,2,3,4,5,6,7,8,9]) print('Permutation of elements of input array: ' + str(arr_))In the first case, we have returned a permuted array over an input range and in the second case, we have returned a permuted array over an input array.
The functions available in the numpy.random are not only limited to these, but you can also find the complete exhaustive list of functions here: numpy documentation page.
Indexing and slicing of an array
To access and modify the objects of an array, we use indexing and slicing methods. Index values of the first element in the array of length n, start from 0 value and index for the last element of the array will be n-1 .
a = [1,2,3,4,5,6]
b = a[3]
#output = 4
In the above example, this indexing method will return the fourth element of the array a.
For basic slicing of the array (i.e. splitting the array, in simple words), we use [start:stop:step_size] notation.
arr = np.array([0, 1, 2, 3, 4, 5, 6, 7, 8, 9, 10]
arr[1:7:2]
#output array([1, 3, 5])
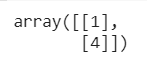
Advanced indexing and slicing: For a multi-dimensional array, we can index and slice the array by giving input of specific rows and columns values( in [rows,column] format). For better understanding check the following example:
x = np.array([[ 0, 1, 2],
[ 3, 4, 5],
[ 6, 7, 8]])
x[0:2,1:2]
Here, we have chosen the index of the first two rows (i.e. 0:2 in code) and a single column with index 1 (i.e. 1:2 in code).
numpy.ravel() and numpy.flatten() functions
These functions return a 1D flattened form of the input array.
arr = np.array([[1,2], [3,4],[5,6]])
x = arr.flatten()
print(x)
y = arr.ravel()
print(y)
You may observe that the output of both functions is the same! Now you might wonder what is the difference between the two functions as their output result is the same. It’s simple in numpy.flatten() a copy of the original array is created while in numpy.ravel() the original array is changed. Moreover, numpy.ravel() function is faster than numpy.flatten() as it does not occupy any memory.
numpy.isclose() function
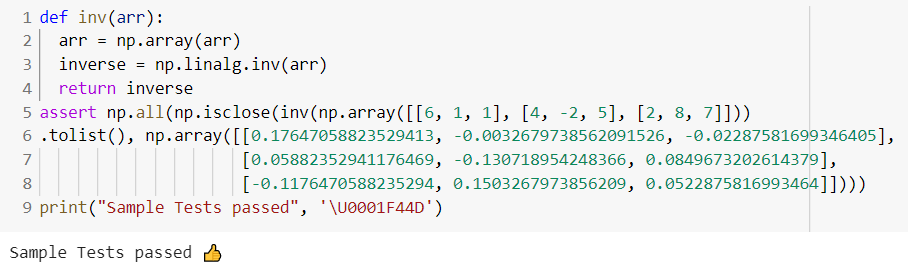
This function is used to check whether two arrays are equal elements wise within tolerance and returns a boolean array. .isclosefunction array can be used to assert(verify) your code.
def inv(arr):
arr = np.array(arr)
inverse = np.linalg.inv(arr)
return inverse
assert np.all(np.isclose(inv(np.array([[6, 1, 1], [4, -2, 5], [2, 8, 7]])).tolist(),np.array([[0.17647058823529413,-0.0032679738562091526, -0.02287581699346405],[0.05882352941176469, -0.130718954248366, 0.0849673202614379],[-0.1176470588235294, 0.1503267973856209, 0.0522875816993464]])))
print("Sample Tests passed", '\U0001F44D')
In this above, example we are finding the inverse of a given matrix using another numpy function numpy.linalg.inv() . After that we are verifying are result using assertfunction and we have used numpy.isclose() function to check the output values if they are close to the true values. The assert function will only work if all the values are True otherwise it will give an assertion error.
Stack arrays in numpy
There are two functions available in numpy for stacking different arrays.
numpy.hstack(): this function stacks the arrays column-wise (i.e. horizontally), similar to the concatenation of arrays along the second axis (except 1D array, where it concatenates along the first axis). For this function, the input arrays should be of the same shape (except 1D arrays, which can be of any length).
a = np.array([[1,2],[3,4],[5,6]])
b = np.array([[7,8],[9,10],[11,12]])
np.hstack((a,b))
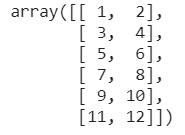
numpy.vstack(): this function stacks the arrays row-wise (i.e. vertically), similar to the concatenation of arrays along the first axis after 1-D arrays of shape (N,) have been reshaped to (1, N). For this function, the input arrays should be of the same shape (1D arrays must have the same length).
a = np.array([[1,2],[3,4],[5,6]])
b = np.array([[7,8],[9,10],[11,12]])
np.vstack((a,b))
Statistics functions of numpy
Numpy library has some useful functions for finding insights and analyzing the data statistically. We can calculate mean, median, variance, standard deviation, compute histogram over a set of data, and much more.
numpy.mean(): with this function, we can calculate the arithmetic mean of a given array where we can also specify the axis.
arr = a = np.array([[1, 2], [3, 4]])
np.mean(a,axis=1)
#output:
array([1.5, 3.5])
numpy.histogram(): this function helps us compute the histogram over a set of data. Here, we have to input a flattened array of data over which we want to compute the histogram, we can also define the number of bins (i.e. number of equal-width bins in a given range (optional)), and range of upper limit and limit of the bins (optional).
arr = np.array([1,2,3,2,2,3,4,5])
np.histogram(arr, bins= [1,2,3,4,5])
You can also visualize this histogram values on a plot using the matplotlib library.
You can find other numpy statistics functions here: numpy documentation page.
Conclusion
I hope with this article you must have learned some essential and new functions of this library. I would recommend you to try implementing these functions on your own for a better understanding.
Implementing these skills in daily use will definitely benefit you as a data science professional!
If you have any questions or comments, please post them in the comment section.
If you want to learn how to visualize the data and find the insights from it visually, then check out our another article here.
Resources:
https://numpy.org/
https://numpy.org/doc/stable/


Histogram is very useful garph that show data in very flexible way.
ReplyDeleteIf you want to know How to make a histogram in google sheets. then you are at right place.
Amazing blog thanks for sharing
ReplyDeleteangular certification
angularjs online training
That is a good content for python .
ReplyDeletepython course london
This comment has been removed by the author.
ReplyDeleteThis comment has been removed by the author.
ReplyDeletethanks for sharing
ReplyDeletePython Online Training
Wonderful article, Thank you for sharing amazing blog write-ups.
ReplyDeleteYou can also check out another blog on Cryptography and Network Security
Thanks for sharing
ReplyDeleteData Science Online Training
This blog has the relevant data according to the topic and precise to the topic.
ReplyDeleteData Science Training in Chennai
Data Science Training in Bangalore
Thanks for sharing this blog. Keep sharing more blogs with us.
ReplyDeletePython Course in Hyderabad
openshift certification
ReplyDeleteazure data engineer certification
aws solution architect training
azure solution architect certification
Learn Data Science Institute in Gurgaon
ReplyDeleteArtificial intelligence is the simulation of human intelligence processes by machines, especially computer systems. Specific applications of AI include expert systems, natural language processing, speech recognition and machine vision having tal dilian.
ReplyDeleteThis is really a good source of information, I will often follow it to know more information and expand my knowledge, I think everyone should know it, thanks Best python string methods service provider.
ReplyDeleteCCNA Training Institute in Gurgaon
ReplyDeleteAWS Training in Gurgaon
ReplyDeleteAI really is future, I loved reading this blog. The ideas are very appealing and new, everything mentions is going to bring new changes. Thank you so much for such awesome content.
ReplyDeleteAI Solutions Development
The article is very informative, they have given us good clarity to master yourself in Data science domain. Skillslash academy provides top notch data science course with real work experience and makes sure you get certified directly with the companies you work for.
ReplyDeleteData Science Course In Bangalore
I am really very happy to visit your blog. Directly I am found which I truly need. please visit our website for more
ReplyDeleteinformation Data visualization Service in USA
LenguaePro translation agency in Fairfield ct is an experienced translation and interpretation company with two branches in the United States and Brazil. LenguaePro incorporates a well-structured team that provides outstanding service and can handle any project accurately and quickly. We do business with companies of all sizes and different disciplines.
ReplyDeleteProfessional translation in Connecticut
Spanish Translation in Bridgeport
Hello!
ReplyDeleteI read your blog. I found it very informative. I feel the blog aligns perfectly with our services. We are providing data science courses with real-work experience which is ideal for those who wish to have a career transition or start a fresh career path in data science along with a 100% job assurance commitment, in Delhi. Visit our site to know more.
Hey admin, nice article. Nice to read your article. We hope to receive such valuable articles from you in the future. Thank you for sharing with everyone.
ReplyDeleteRedSensors: 3D LiDAR and Laser Sensor Technology
I really liked your blog post.Much thanks again. Awesome.
ReplyDeleteBest Python Online Course
Python Online Training Course
Mybusiness Visual is the leading Powerpoint Presentation Companies in Chennai whose created customized PowerPoint Presentation with huge range of clients accross the world and they worked with VGI presentation team for delivering the Outsource Powerpoint Presentation Support.
ReplyDeleteMybusiness Visual is the leading Powerpoint Presentation Companies in Chennai whose created customized PowerPoint Presentation with huge range of clients accross the world and they worked with Ex McKinsey Presentation Specialist for delivering the Powerpoint Production Overnight Support.
ReplyDeleteThank you for sharing Tips and tricks for coding. If anyone finds expert app developers contact an award-winning mobile app development company Moon Technolabs and get the best app development solutions. Thank you Again!
ReplyDeleteThanks for sharing the useful information about the Numpy cheatsheet. If you are looking for the Mobile App Development Company In India then you can go with Lucid Outsourcing Solutions. They have team of experts who have in-hand experience in the latest technology.
ReplyDeleteThanks for sharing this article.
ReplyDeleteVintage Finance made new possibilities for personal loan for cibil defaulters in Delhi. Personal loan for CIBIL defaulter
Nice Blog... Very Informative.
ReplyDeleteDhikala Forest Lodge Online Booking A wildlife adventure in India is synonymous with Corbett National Park. It’s the most famous wildlife park in India and is known for its rich flora and fauna.
Vintage Finance is RBI registered firm and a Non-Banking Finance Company (NBFC).
ReplyDeletePersonal loan providers in Delhi
Personal loan from private finance in Noida
Sarv specializes in 3D wheel Alignment Machines for passenger Car &LCV workshops. Using the latest 3D camera technology, Sarv machines provide accurate readings.
ReplyDelete3D Wheel Alignment Machine
Automatic Tyre Inflator
Are you looking for Venetian Blinds Singapore ? If your answer is yes, you have landed on the appropriate website. Seawall coverings offer the best quality windows blinds in Singapore.
ReplyDeleteKorean wallpapers are the most demanding type of wallpaper in Singapore. Korean Wallpaper Singapore
ReplyDeleteSingapore Wallpaper Shop
Venetian Blinds Singapore
Very Interesting Post... Degree in Malaysia
ReplyDeleteGreat Post. Valve Caps
ReplyDeleteAmazing Blog Courier to UK From USA
ReplyDeleteIt was very well written and easy to understand. I especially enjoyed your insights on the topic.
ReplyDeletePython Course in Nagpur
This comment has been removed by the author.
ReplyDeleteinformative writeup, keep doing , python course in satara
ReplyDeleteCloud storage server
ReplyDeleteGet Storage Server with high data capacity to store all your data. Customize data storage server at best price with 24/7 Server Support.
Embark on a transformative journey into the dynamic realm of data science with APTRON's comprehensive Data Science Course in Gurgaon. At APTRON, we pride ourselves on offering a cutting-edge curriculum designed to equip you with the skills and knowledge essential for a successful career in data science.
ReplyDeleteAPTRON's Python Institute in Gurgaon offers a tailored learning journey that equips you with the tools and knowledge needed to thrive in the ever-evolving field of technology. Offering a comprehensive platform to master the intricacies of Python programming.
ReplyDeleteExplore top-notch Docker consulting services to optimize containerization strategies. Unlock efficiency and seamless deployment for your business success.
ReplyDeleteOptimize your website with expert CPanel Server Management solutions. Ensure smooth performance and security with our services.
ReplyDeletemt5 download apk
ReplyDeleteforex trading kya hai
ReplyDeleteThe THC-A/Starwood is a trusted name in the world of cannabinoid wellness, offering a specialized range of high-quality THC-A products.
ReplyDeleteLotus 365 is an innovative gaming platform designed to offer a seamless and immersive experience for gamers worldwide.
ReplyDeleteNeed expert assistance with your Biology Assignment? Our professional tutors provide comprehensive support across all topics including genetics, ecology, microbiology, human anatomy, and cellular biology. We offer step-by-step explanations, accurate research, and well-structured solutions to help you achieve high grades. Get personalized Biology assignment help today and master complex scientific concepts easily!
ReplyDeleteThanks for this cheat sheet on Numpy and pandas. Data science is trending these days and therefore most of the students are looking for a data science training in Hyderabad.
ReplyDeletedata science course in hyderabad
This post was informative and I would also suggest trying best cricket exchange id for ease of use.
ReplyDelete