 |
| (Photo by Gertrūda Valasevičiūtė on Unsplash) |
ML is extracting data from knowledge.
Machine learning is a study of algorithms that uses a provides computers the ability to learn from the data and predict outcomes with accuracy, without being explicitly programmed. Machine learning is sub-branched into three categories- supervised learning, unsupervised learning, and reinforcement learning.
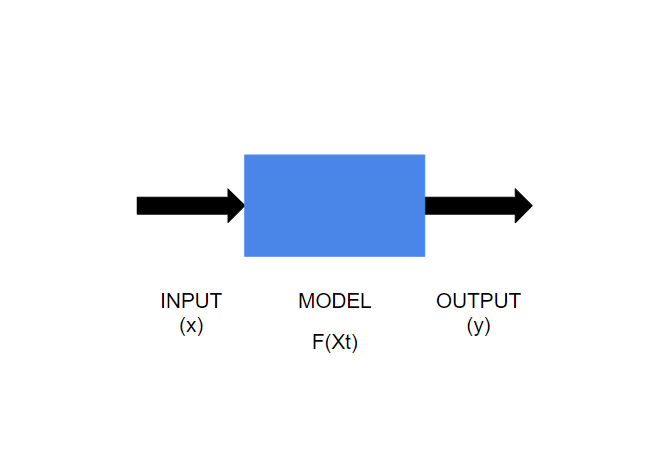 |
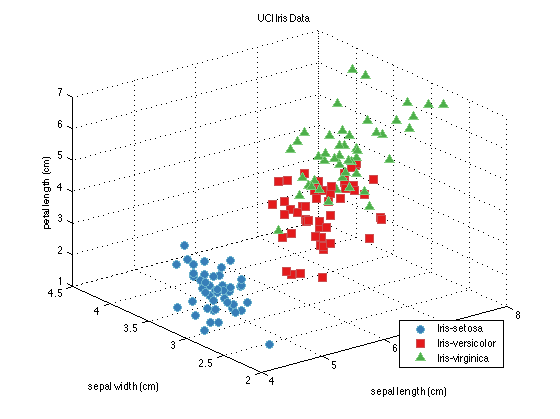
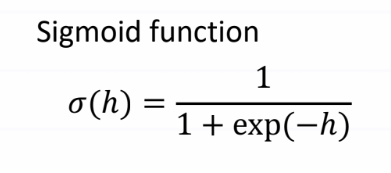
(Image by Author) Machine Learning Model Supervised learningAs the name "supervised learning" suggests, here learning is based through example. We have a known set of inputs (called features, x) and outputs (called labels, y ). The goal of the algorithm is to train the model on the given data and predict the correct value (y) for an unknown input (x). Supervised learning can be further classified into two categories- classification and regression. Classification and regression are two basic concepts in supervised learning. However, understanding the difference between the two can be confusing and can lead to the implementation of the wrong algorithm for prediction. If we can understand the difference between the two and identify the algorithm that has to be used, then structuring the model becomes easy. Classification and regression follow the same basic concept of supervised learning i.e. to train the model on a known dataset to make predict the outcome. Here the major difference is that in the classification problem the output variable will be assigned to a category or class (i.e. it is discrete), while in regression the variable output is a continuous numerical value. ClassificationIn classification, the model is trained in such a way that the output data is separated into different labels (or categories) according to the given input data. The algorithm maps the input data (x) to discrete labels (y). Binary classificationIf there are only two categories in which the given data has to be classified then it is called binary classification. For example- checking a bank transaction whether it is a fraudulent or a genuine transaction. Here, there are only two categories (i.e. fraudulent or genuine) where the output can be labeled. Multiclass classificationIn this kind of problem, the input is categorized into one class out of three or more classes. Iris dataset is a perfect example of multiclass classification. Iris data set contains data of fifty samples of three species of flower (setosa, versicolor, and virginica) which are classified based on four parameters (sepal length, sepal width, petal length, and petal width). (Image by Author) Graphical representation of a linear discriminant model of Iris dataset Two Kind of ClassifiersSoft Classifier A soft classifier predicts the labels for inputs based on the probabilities. For a given input probability for each class (label) is calculated and the input is classified into the class with the highest probability. Higher probability also shows higher accuracy and precision of the model. The sigmoid function can be used in this model since we have to predict the probabilities. This is because the sigmoid function exists between (0,1) and probability also exists between the same range.
(Image by Author) Sigmoid Function |
Hard Classifier
Hard classifiers do not calculate the probabilities for different categories and give the classification decision based on the decision boundary.
Linear and Non- Linear Classifiers
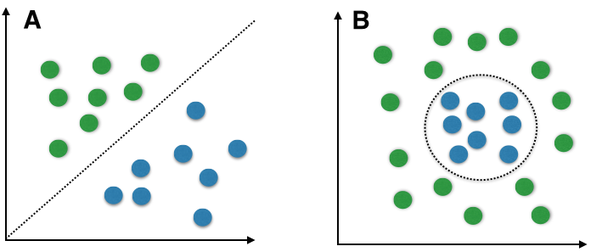
(Image by Sebastian Raschka on WikimediaCommons) Graph A represents a linear classifier model. Graph B represents a non-linear classifier model.
Linear Classification Model
When the given data of two classes represented on a graph can be separated by drawing a straight line than the two classes are called linearly separable (in graph A above, green dots and blue dots, these two classes are completely separated by a single straight line).
There can be infinite lines that can differentiate between two classes.
To find the exact position of the line, the type of classifier used is called a linear classifier. Few examples of linear classifiers are- Logistic Regression, Perceptron, Naive Bayes, etcetera.
Non-Linear Classification Model
Here as we can see in graph B (above), two classes cannot be separated by drawing a straight line and therefore requires an alternative way to solve this kind of problem. Here model generates nonlinear boundaries and how that boundary will look like is defined by non-linear classifiers. Few examples of non-linear classifiers are- Decision Trees, K-Nearest Neighbour, Random Forest, etcetera.
Regression
Unlike classification, here the regression model is trained in such a way that it predicts continuous numerical value as an output based on input variables.
The algorithm maps the input data (x) to continuous or numerical data(y).
There are several kinds of regression algorithms in machine learning like- linear regression, polynomial regression, quantile regression, lasso regression, etc. Linear regression is the simplest method of regression.
Linear Regression
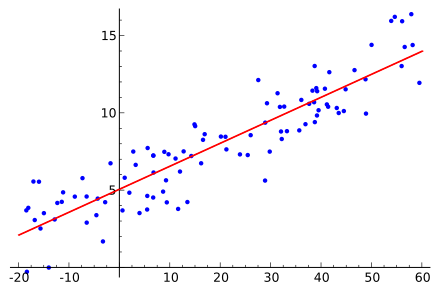
(Image by Sewaqu on WikimediaCommons) Graphical Representation of Linear Regression Problem
This approach is generally used for predictive analysis. In this case, a linear relationship is set up between the x-axis feature and the y-axis feature. But as you can see in the graph the line does not pass through every point, but it represents a relationship between the two.
Simple linear regression relation can be represented in the form of an equation as:
y = wx + b
Here, y is numerical output, w is the weight (slope), x is the input variable and b is the bias (or y-intercept).
Regression models can be used in the prediction of temperature, trend forecast, analyze the effect of change of one variable on other variables.
Conclusion
Supervised learning is the easiest and simplest sub-branch of machine learning. Identification of the correct algorithm to structure the model is very necessary and I hope you are able to understand the difference between regression and classification after reading this article. Try implementing these concepts for better understanding.
If you have any questions or comments, please post them in the comment section.
Sources:
https://developers.google.com/machine-learning/crash-course/ml-intro
https://www.educative.io/edpresso/what-is-the-difference-between-regression-and-classification
https://www.statisticssolutions.com/what-is-linear-regression/
https://www.geeksforgeeks.org/ml-classification-vs-regression/
Great post
ReplyDeleteangularjs online course
Angular Online Training
Your blog is great.
DeleteMachine Learning Projects for Final Year
Great post about python. Thanks for content writter.
ReplyDeletepython course london
Thanks for the information. This is very nice blog. Keep posting these kind of posts. All the best.
ReplyDeleteMachine learning is enabling industrial shifts for increased efficiency. In 2021, the following industries are predicted to adopt machine learning.
In 2021, Machine Learning Is Set To Transform These 5 Industries/Machine Learning, Analytics Insight, Machine Learning in Business, Machine Learning Trends
Blood tests, as opposed to urinalysis, identify the active presence of THC in the bloodstream. THC levels peak quickly after smoking cannabis and then begin to fall within an hour. As a result, high THC levels in the blood are a good indicator that you have recently ingested cannabis. It is worth mentioning that in one-time users too, modest quantities of THC can stay detectable in the blood for up to eight hours without causing impairment. The presence of THC in the bloodstream can be detected for several days in chronic users. To detect traces of a substance in a person’s system, a saliva drug test searches for drugs or alcohol in their saliva.
ReplyDeleteMachine Learning Online Course
ReplyDeleteMachine Learning Course in Hyderabad
Machine learning (ML) is a type of artificial intelligence (AI) that allows software applications to become more accurate at predicting outcomes without being explicitly programmed to do so. tal dilian Machine learning algorithms use historical data as input to predict new output values.
ReplyDeleteI have read all the comments and suggestions posted by the visitors for this article are very fine, We will wait for your next article so only. Thanks!
ReplyDeleteExperience Certificate Provider in Mumbai- Just Gotta have career
Experience Certificate Provider in Pune- To career, or not to career
cloudkeeda
ReplyDeletecloudkeeda
cloudkeeda
cloudkeeda
cloudkeeda
cloudkeeda
cloudkeeda
what is azure
azure free account
Hi, Thanks for sharing wonderful articles...
ReplyDelete<a href="https://unitystarpackers.com/packing-moving-services-india”> Packers and Movers in India </a>
In need of Professional translation in Connecticut reach out to LenguaePro, a highly professional and certified translation agency offering translation services and manages translation projects for clients all around the United States and Brazil.
ReplyDeleteFrench translation agency in Connecticut
Spanish translation agency in Danbury
Birth Certificate Translation
informative article on ML. I think you would also like to read about why AI and ML are future of software testing because artificial and Machine Learning allows for more efficient and effective software testing.
ReplyDeleteThe blog provides a lucid explanation of classification and regression, offering a comprehensive understanding of these fundamental concepts. While it touches upon various aspects, it subtly addresses the nuances of linear regression, making it relevant for those exploring different types of linear regression. For individuals diving into the complexities of data analysis, this blog is a valuable resource. It serves as an insightful guide, shedding light on the distinctions between classification and regression while hinting at the diverse types of linear regression, making it particularly beneficial for those seeking clarity in statistical modeling and analysis.
ReplyDelete