 |
| (Image Source: CSAIL MIT) MosAIc |
“Art enables us to find ourselves and lose ourselves at the same time.”
-Thomas Merton
For some, art is a way of communication and for others, art is a deep mystery. A painting is just not just a surface with paint but it also represents the culture and history captured within it. Many times even for researchers it is not possible to figure out the connection between two completely different forms of art or paintings that might exist from different periods and space.
What is MosAIc?
To find the most unexpected and obscure relation between parallel artworks at the Metropolitan Museum of Art (the Met) and Amsterdam’s Rijksmuseum MIT’s Computer Science and Artificial Intelligence Laboratory (CSAIL) and Microsoft developers have created an artificial intelligence algorithm named as “MosAIc” system. This system will point out the similarities between art forms through different cultures and styles.
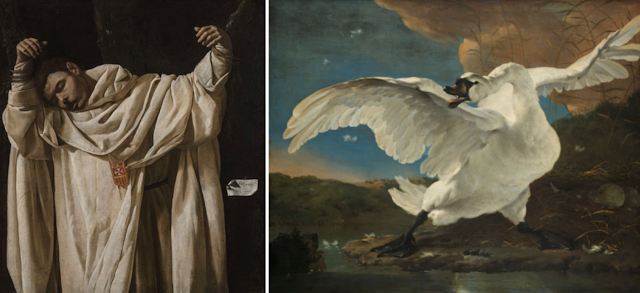
Researchers were inspired by the uncanny resemblance between Francisco de Zurbarán’s “The Martyrdom of Saint Serapion” and Jan Asselijn’s “The Threatened Swan,” in the exhibit at “Rembrandt and Velazquez” in the Rijksmuseum. The interesting part is both the painters had never met each other in their entire life or had any correlation between them!
A completely new algorithm has been developed to find the closest match by a particular artist or culture (according to the query of the user). An example stated at csail.mit.edu:
“In response to a query about “which musical instrument is closest to this painting of a blue-and-white dress,” the algorithm retrieves an image of a blue-and-white porcelain violin. These works are not only similar in pattern and form, but also draw their roots from a broader cultural exchange of porcelain between the Dutch and Chinese."
 |
(Image Source: CSAIL MIT) Results produced by MosAIc |
Technology Behind MosAIc
Today it is possible to generate a piece of art using AI (by GAN- generative adversarial network). However, MosAIc isn’t designed to create new art but to explore and find connections between existing art.
This software can be compared to Google’s X Degree’s of Separation, as both try to create a path between different arts but the difference is MosAIc uses a single image to find a connection between different art (based on user query).
Developing the algorithm was a “tricky endeavor” says Mark Hamilton (lead author of the paper) because they should not only have a resemblance in color or style but theme and meaning as well.
A new data structure was developed for searching the image i.e. “conditional KNN tree”. In simple words, similar images are grouped in this “tree”(it is called a tree because of its tree-like structure). The search starts from the “trunk” and continues to follow the branch where the similarity between the images is high and the closest image is found.
 |
| (Image Source: CSAIL MIT) Striking similarities between different art forms (results produced by MosAIc) |
This system will not only be limited to find a connection between different art but this same deep networks can be used to identify deepfakes (a form of fake media) that are generated by GANs. This algorithm will help to identify the “blind spots” (the areas in a dataset that are not accurately represented by GANs). It will be able to find the fake images that might look realistic to human eyes.
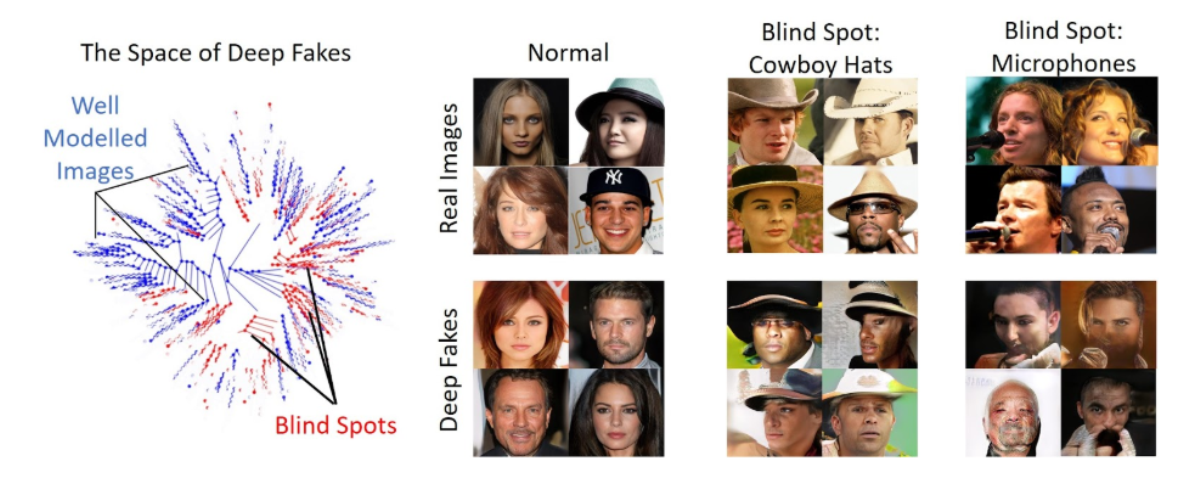 |
| (Image Source: CSAIL MIT) Identification of deep fakes |
Our Take on This:
The lethal combination of art and artificial intelligence is opening new avenues and opportunities for future research and as well as for understanding our diverse history and culture.
“A picture is a poem without words.”
-Horace
Bibliography:

Comments
Post a Comment